Sample Points from a Curve
PythonHardalgebraarraysmath
Instructions
Create a function that given a type of curve will generate a list containing a samples amount of numbers calculated from said curve.
It's easier to see with a visual representation:
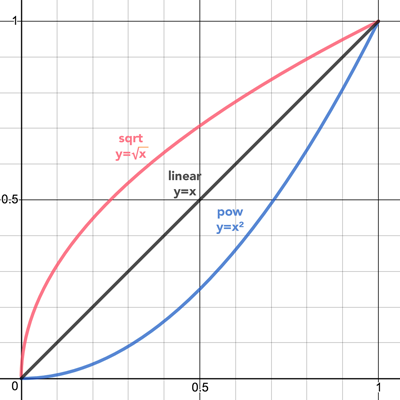
If samples = 3 and curve = "pow", we would sample 3 points along the x axis [0, 0.5, 1] and figure out the value of y, in the case of the pow curve the values are [0, 0.25, 1].
Examples
samples_from_curve(3, "linear") ➞ [0, 0.5, 1]

samples_from_curve(3, "pow") ➞ [0, 0.25, 1]

samples_from_curve(3, "sqrt") ➞ [0, 0.71, 1]

samples_from_curve(5, "linear") ➞ [0, 0.25, 0.5, 0.75, 1]
Notes
- The available curves are
linear,pow,sqrtas shown in the picture. - All values returned must have a maximum of 2 decimals to avoid floating point problems in the tests.
- All values returned must be between
0and1(inclusive). - The
samplesparameter will always be ≥2. - The samples are evenly distributed along the x axis.
python3
Loading editor…
⌘ ↵ to run
Walks through the solution with reasoning and edge cases.